Investor-Grade Revenue Analytics

MetriQ:
Revenue Analytics

RevenIQ imports your complete data set of billing, invoicing, and customer data, forming a comprehensive financial report that helps you uncover insights you need to improve your SaaS business! Gain access to the comprehensive subscription dataset and learn everything you need to – spot churn from a mile away!

What To Expect

Once ReveniQ imports all your invoices, customer and product data, there are mutiple ways to analyse this data: 

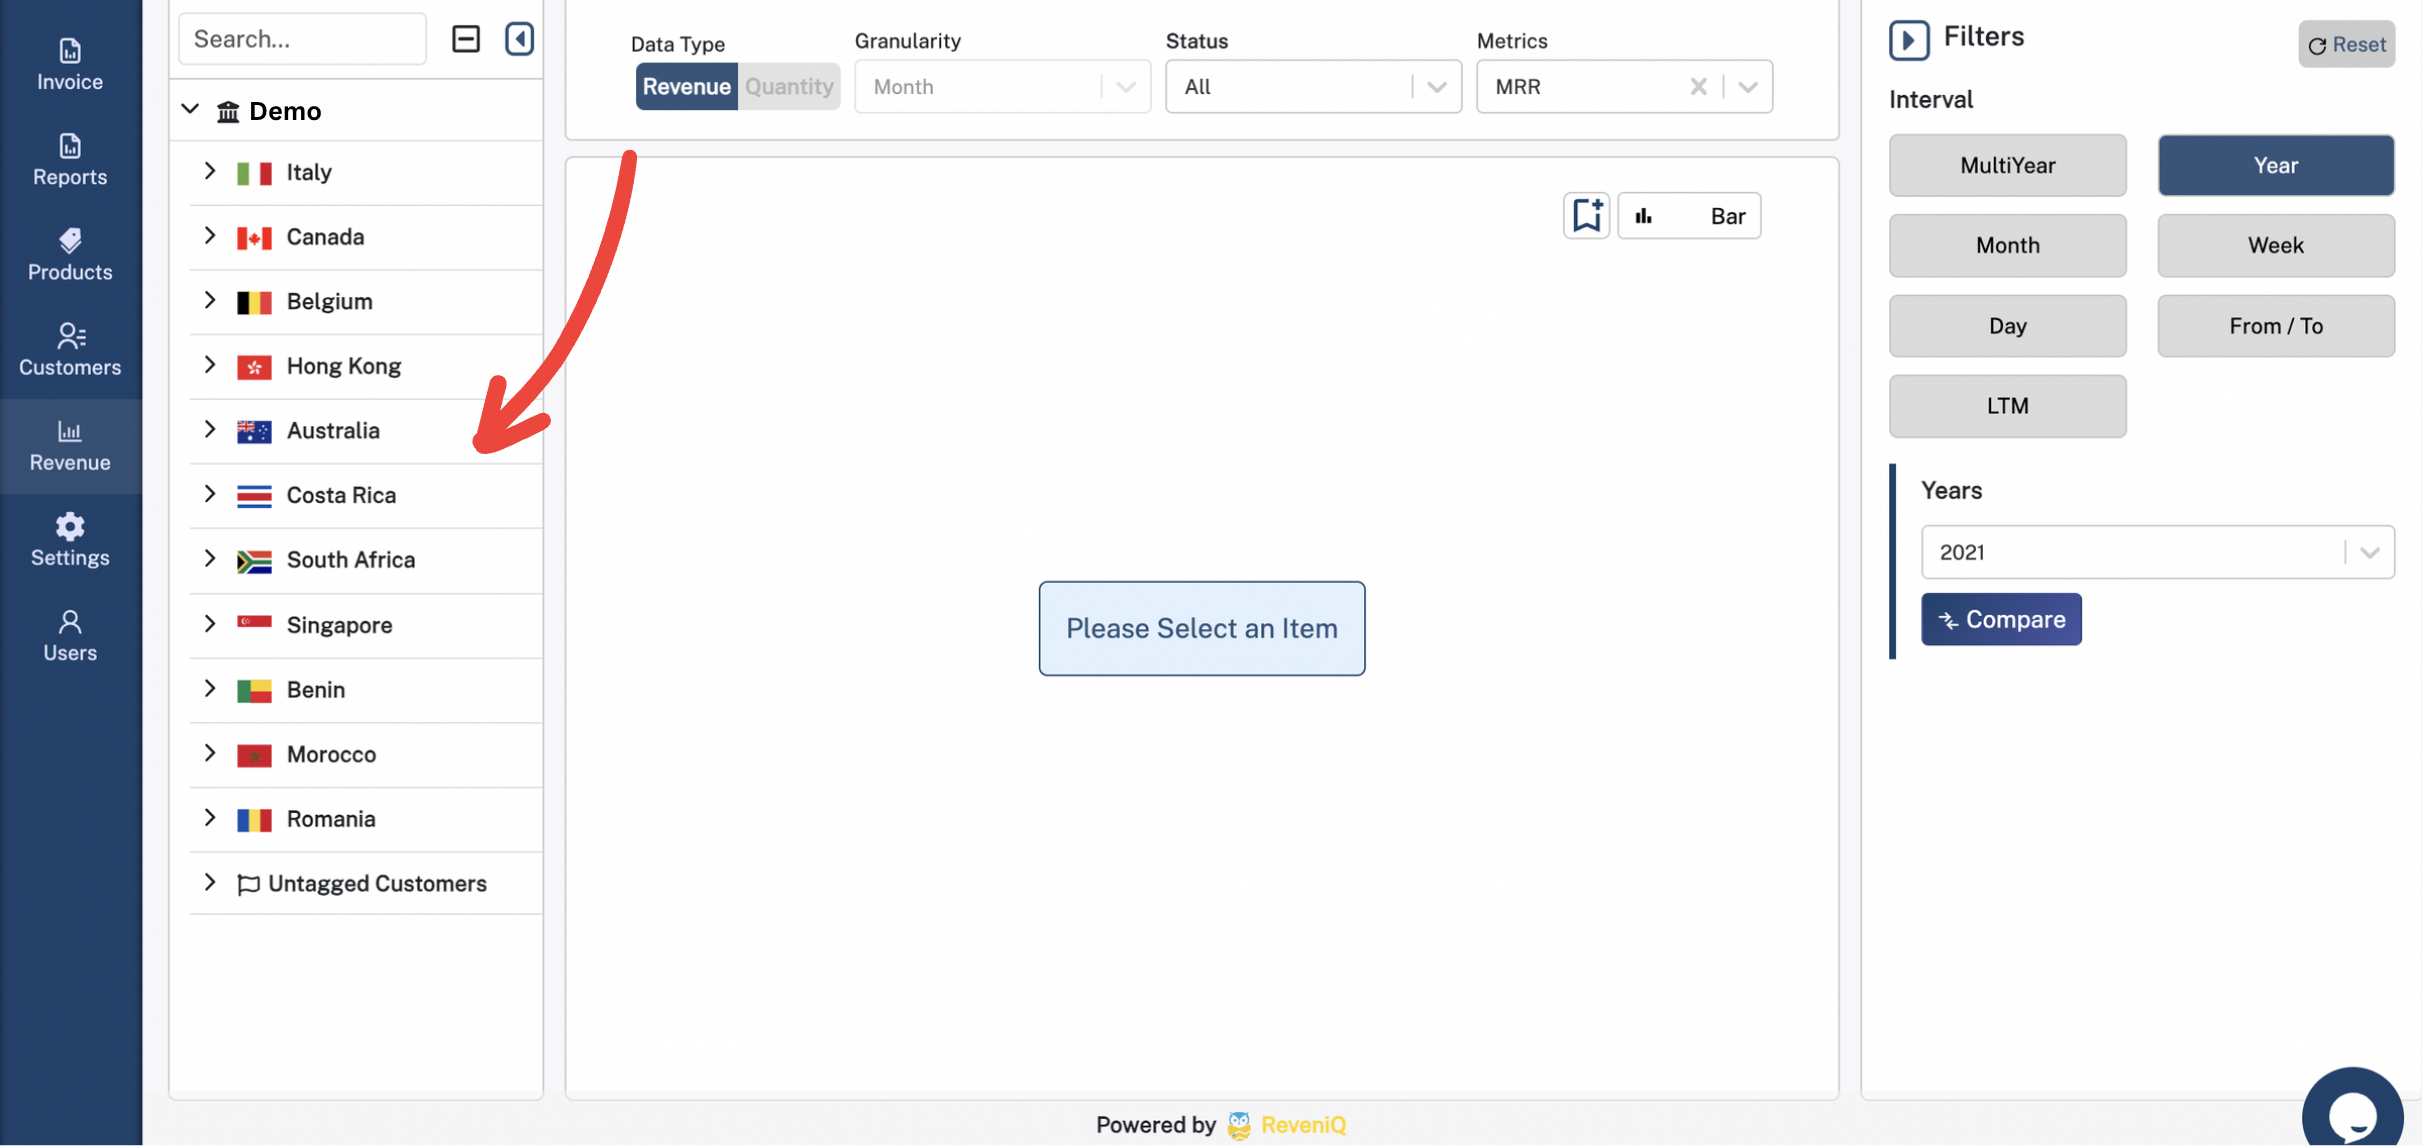
Take a hard look at all the customer subscriptions and billing information. 

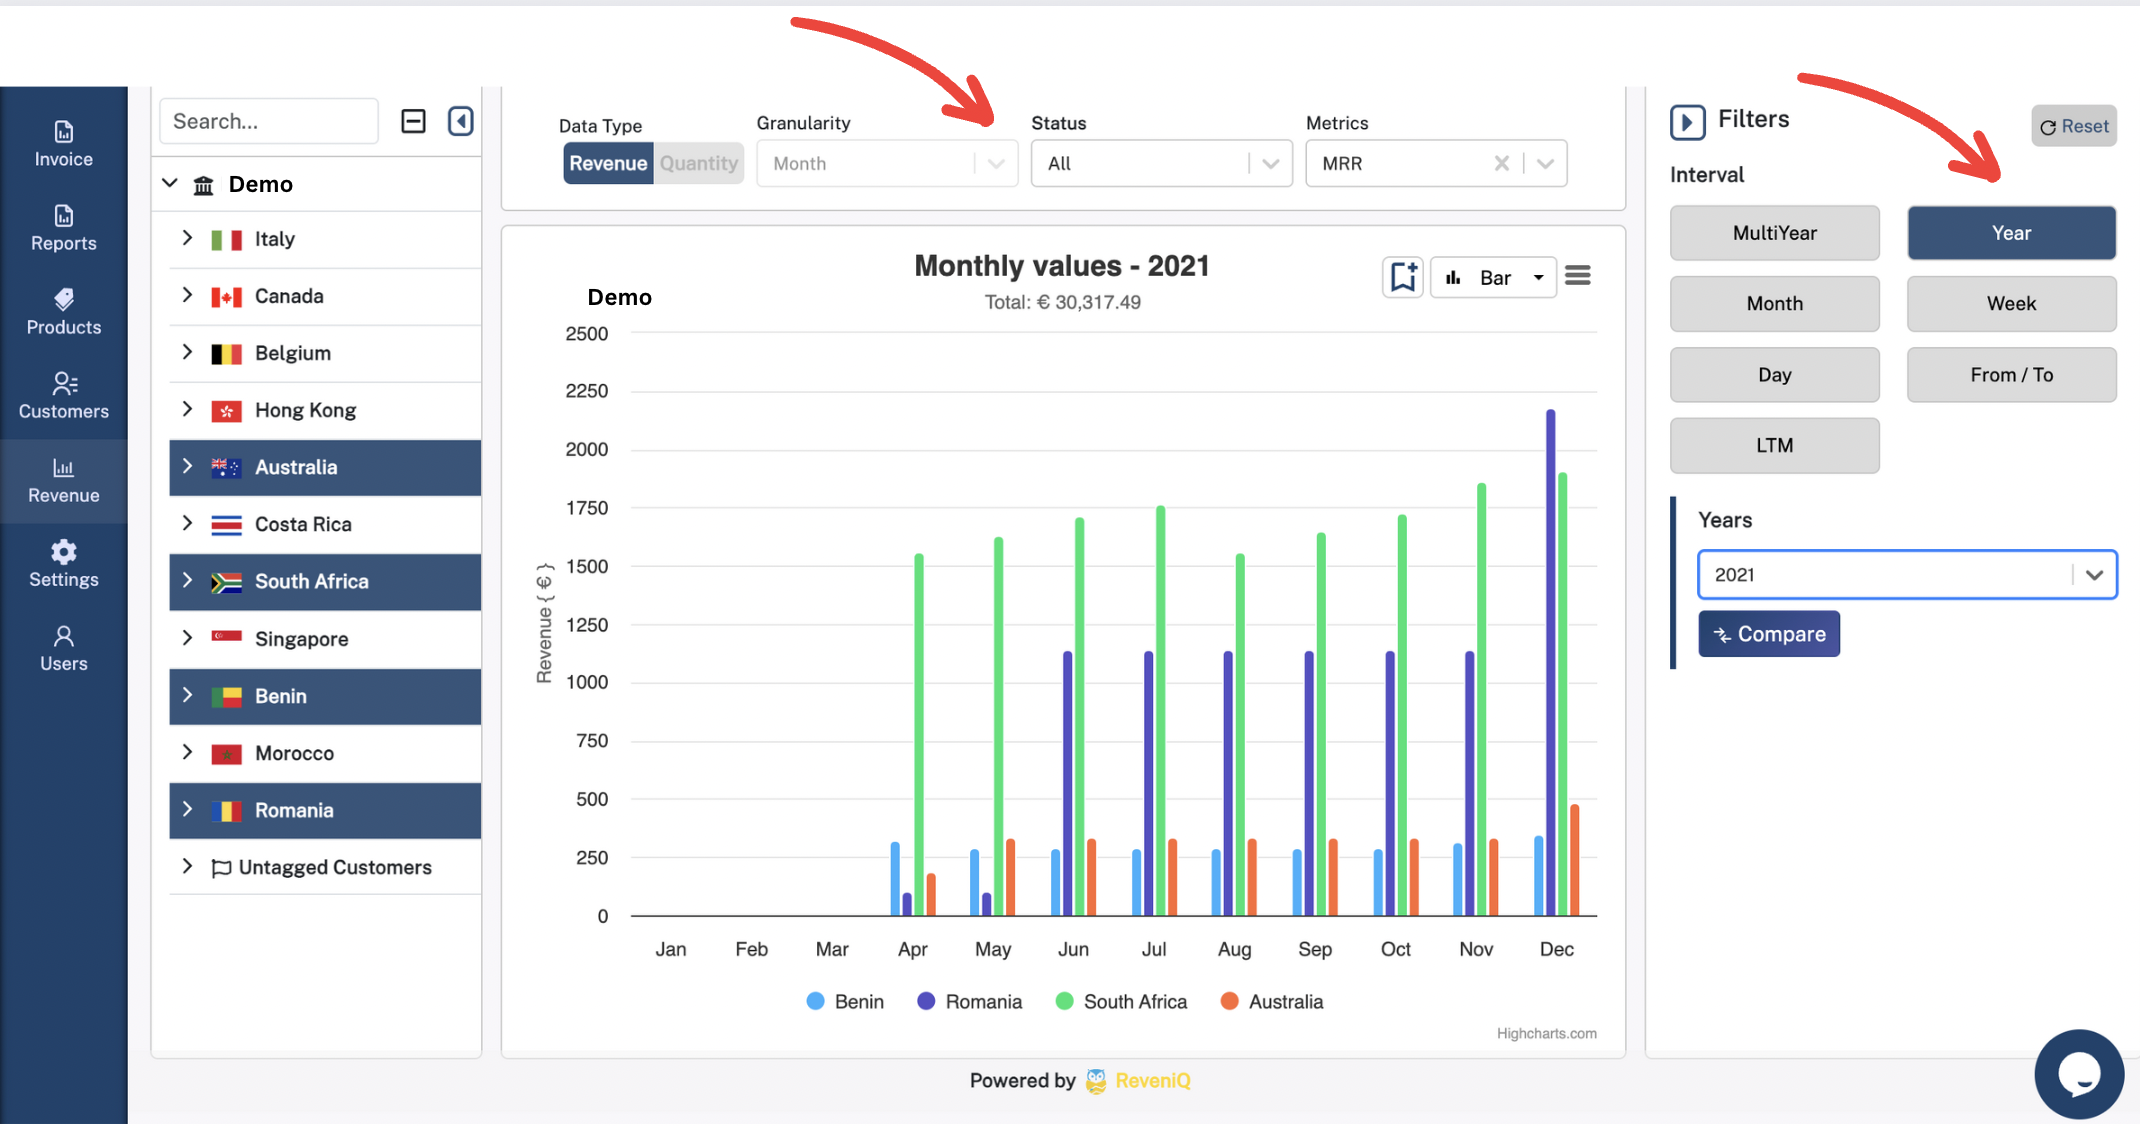
Run calculations with the billing and invoicing records that are updated in real time.

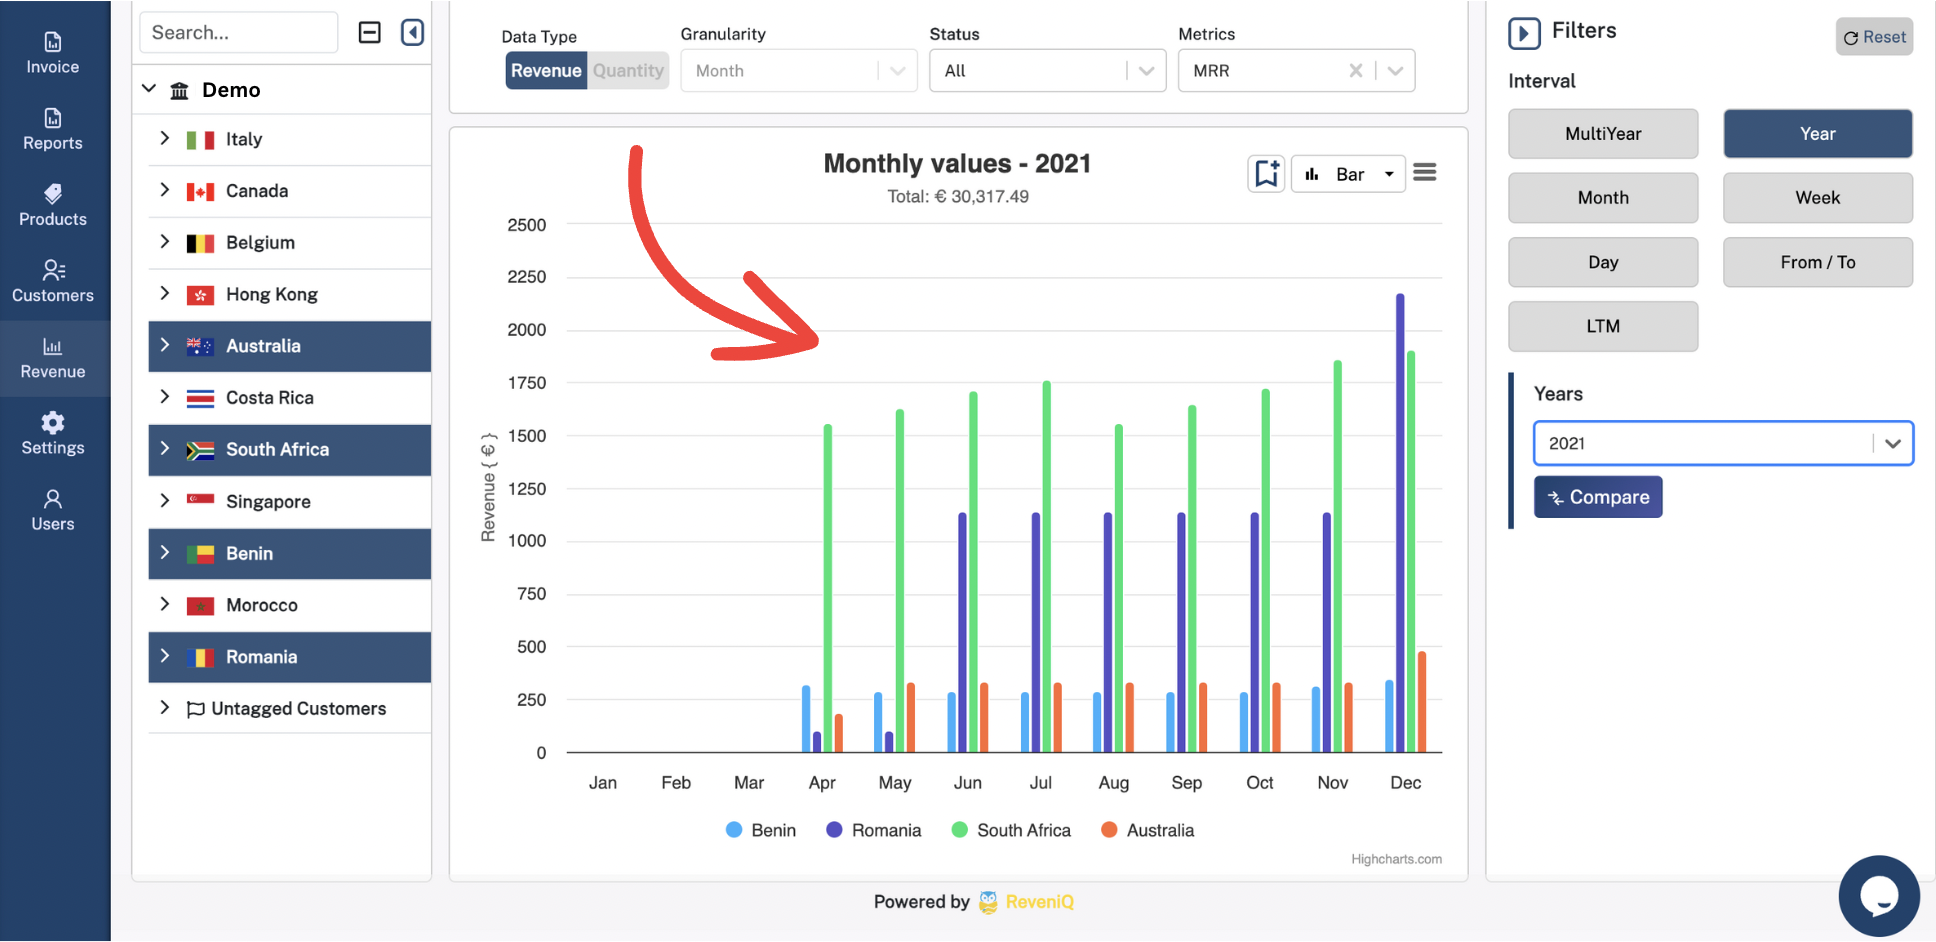
Segment financial data by customers, products & geographical locations.

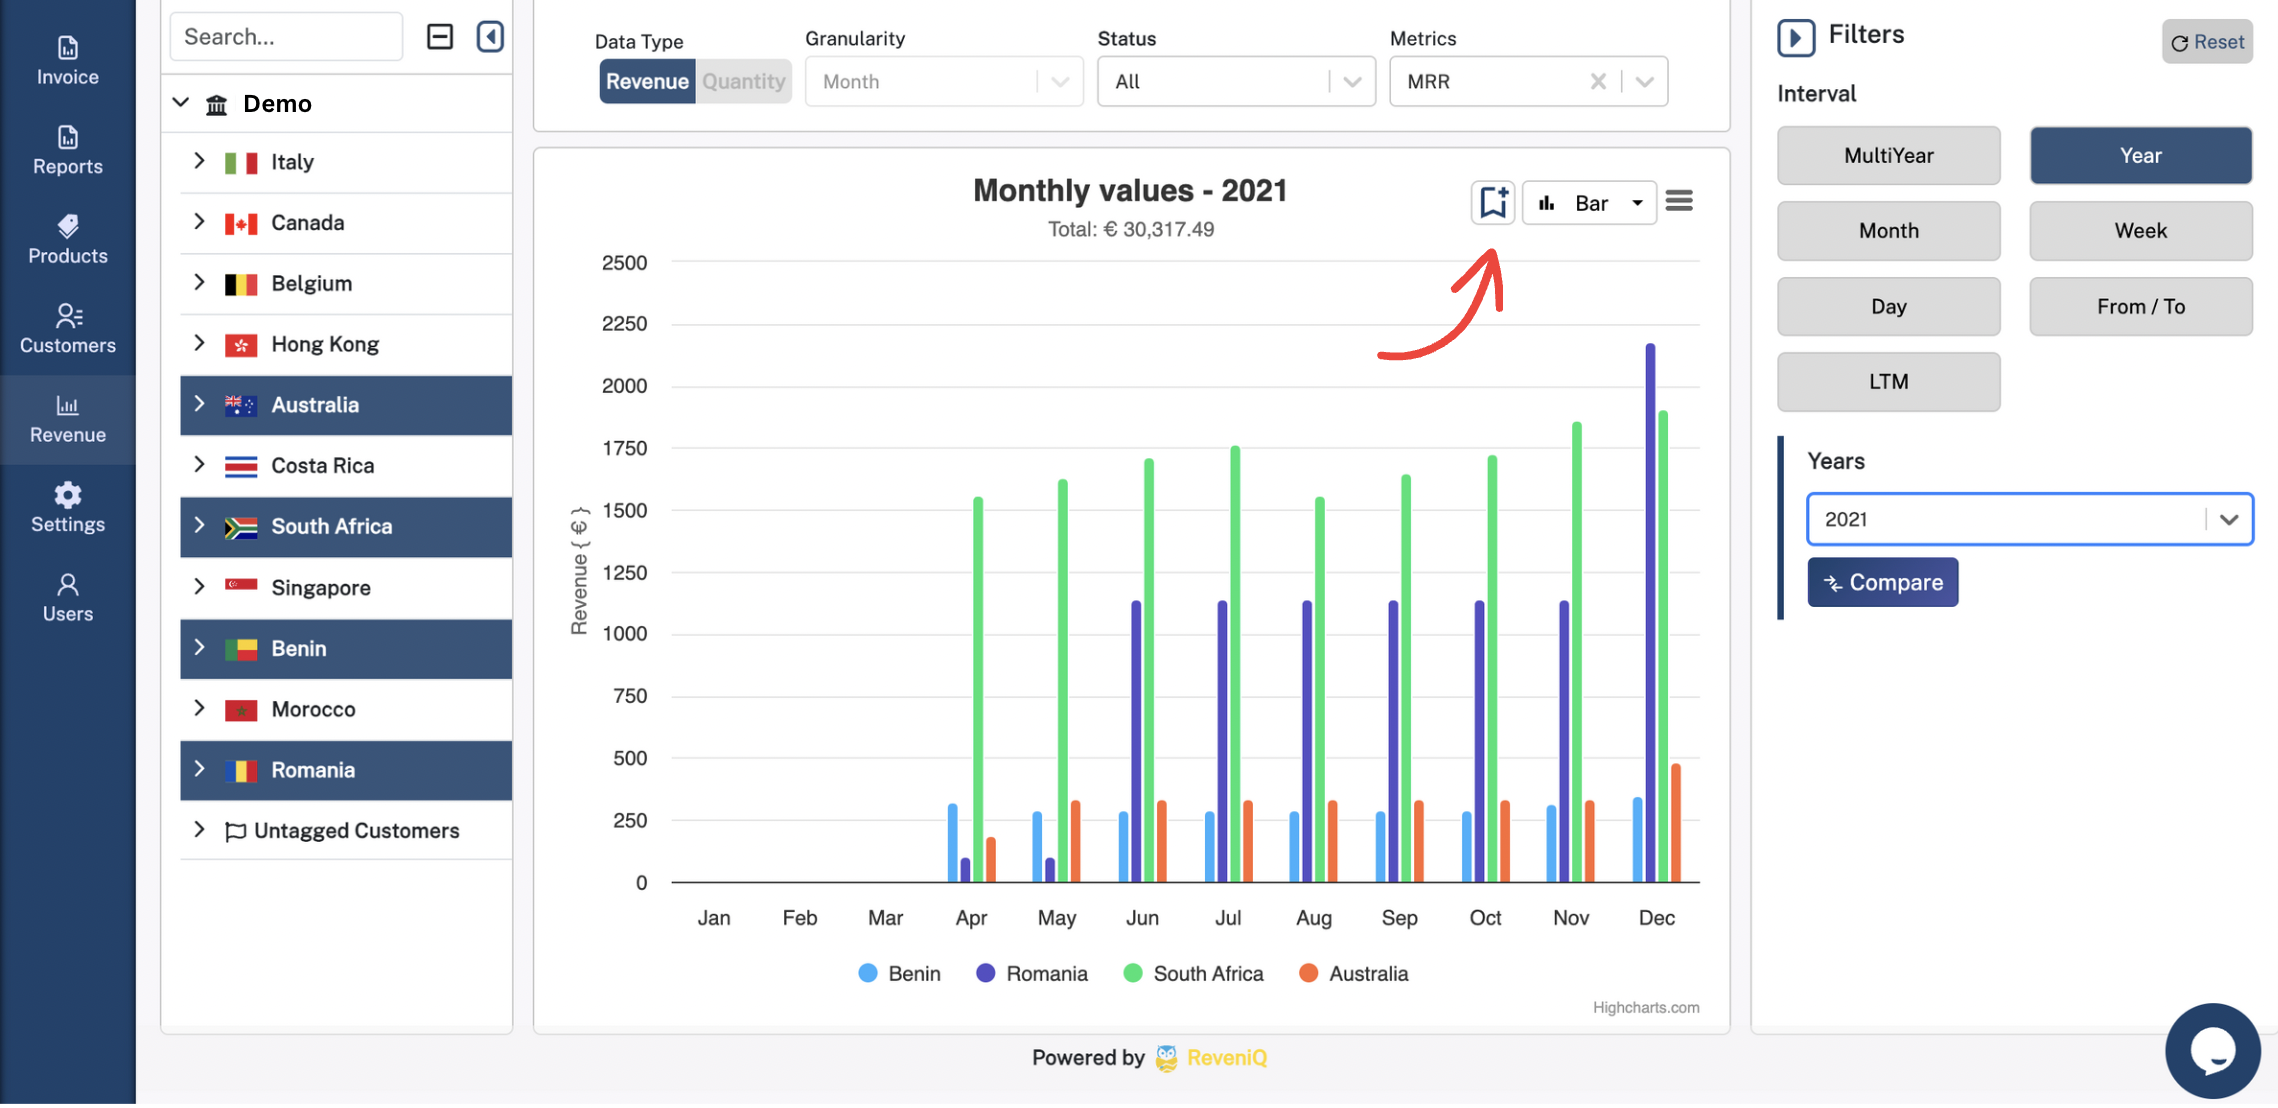
Generate financial reports and share them across sales platforms.

Revenue Analytics To Count On

Use ReveniQ’s powerful segmentation tools to see how well your business is doing and find the driving forces behind your success.

Use activity data to find and focus your attention on the customers most at risk of churning.

Easy Visualisation

You have the flexibility to choose which products to incorporate into the graph. Additionally, an exciting new feature allows you to segment products by geographical location. 

Segmentation

segmentation_reveniq

Customize Settings

Your Pick Of Filters

There are several filters you may add to your visualisation – such as picking between revenue or quantity (what you want to be displayed on the Y-axis), vs daily/weekly/monthly/yearly timeframes to be displayed on the X-axis. 

Your Board of Insights

This is a great way for you to visualise how certain products/customers have been performing over the selected timeframe. 

Analytics Display

favorite analytics

Your Favorite Dashboards

 Designate charts with filters you wish to monitor regularly as a “favorite” to have it prominently displayed on your main dashboard, ensuring real-time updates and easy access for ongoing tracking.

Your Revenue Analytics

Analyse your financial data with your choice of pictorial representation, get them customized, and have them sent to your email. 

Check On Your metrics

Gain access to the comprehensive subscription dataset and learn everything you need to – spot churn from a mile away!